A neighbor of mine spent close to $18,000 on a rooftop solar installation last spring, and three months in, his electricity bill had barely budged. He called me frustrated, convinced he’d been scammed. As we dug into it together, we found the culprit: a combination of poor panel orientation, an undersized inverter, and a net metering agreement he hadn’t fully read. That conversation is exactly why I want to walk you through what actually matters when you’re thinking about solar panels for your home in 2025 — not the glossy brochure version, but the real one.
The 2025 Solar Market: What the Numbers Actually Tell Us
Let’s start with the data, because the landscape has shifted meaningfully. As of early 2025, the average cost of residential solar in the US sits around $2.80–$3.20 per watt before incentives, according to Lawrence Berkeley National Laboratory’s Tracking the Sun dataset. For a typical 8 kW system, that puts your gross cost at roughly $22,400–$25,600. After the federal Investment Tax Credit (ITC) at 30%, you’re looking at a real out-of-pocket figure closer to $15,700–$17,900.
Here’s where people miscalculate: the ITC only works if you have sufficient federal tax liability. If your annual tax bill is $3,000 and your credit is $6,700, you won’t get the difference as a refund — it rolls forward, but only for a limited number of years. Make sure you run this with a tax professional, not just the sales rep.
Panel efficiency has also improved noticeably. In 2025, mainstream monocrystalline panels from brands like Jinko Solar, LONGi, and REC Group are hitting 22–23% efficiency in real-world residential settings. A decade ago, 17–18% was considered excellent. This matters because higher efficiency means fewer panels needed to hit your target output — critical if your roof space is limited.
The Three Things My Neighbor Got Wrong (And How to Avoid Them)
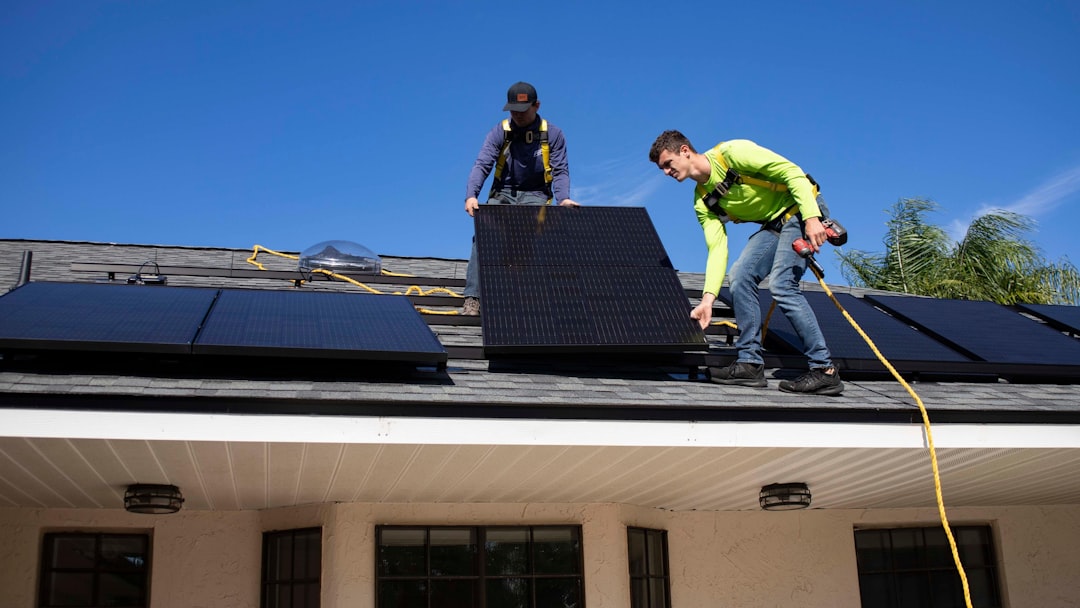
- Panel Orientation & Tilt Angle: South-facing at a tilt angle matching your latitude (roughly 30–40° for most of the continental US) delivers peak annual yield. His panels were southwest-facing at a 15° tilt — that alone can reduce annual output by 12–18% compared to optimal positioning.
- Inverter Sizing: He had a 5 kW string inverter paired with an 8 kW panel array. When production spiked on clear days, the inverter clipped the output — a real, measurable loss. The rule of thumb is to keep the DC-to-AC ratio between 1.1 and 1.25. Going above 1.3 starts causing noticeable clipping losses.
- Net Metering Fine Print: His utility (a mid-size cooperative) had switched from 1:1 net metering to a avoided cost credit structure — meaning excess solar exported to the grid was credited at roughly 4 cents/kWh instead of the retail rate of 14 cents/kWh. That’s a 71% reduction in the value of exported energy. Always check your utility’s current interconnection tariff before signing anything.
Microinverters vs. String Inverters vs. Power Optimizers: A Practical Breakdown
This is probably the decision that generates the most confusion, so let’s be concrete about it.
String inverters (brands like SMA, Fronius, SolarEdge’s older lineup) are the most cost-effective upfront — typically $1,000–$1,500 for an 8 kW system. The weakness: if one panel is shaded or fails, the entire string’s output drops. Best for: unobstructed south-facing roofs with no shading issues.
Microinverters (Enphase IQ8 series is the dominant player in 2025) convert DC to AC at each individual panel. Cost premium is real — roughly $0.20–$0.30 more per watt — but panel-level monitoring and shade tolerance are genuinely superior. The IQ8 also has a “grid-agnostic” feature that allows limited off-grid operation during outages even without a battery, which is a notable differentiator. Best for: complex rooflines, partial shading, or anyone who wants panel-level data.
Power optimizers (SolarEdge HD-Wave system) sit between these two in cost and capability. DC optimization happens at the panel, but conversion to AC still happens at a central inverter. Good middle ground if budget is a constraint but shading is a moderate concern.
Battery Storage in 2025: Worth It or Not Yet?
The short answer: it depends heavily on your utility’s policies and your local grid reliability. The Tesla Powerwall 3 (released in late 2024 and now widely available) offers 13.5 kWh of usable capacity with an integrated inverter at around $11,500 installed. The Enphase IQ Battery 5P, stackable in 5 kWh increments, runs roughly $4,500–$5,000 per module installed.
If you’re on a time-of-use (TOU) rate — where electricity costs significantly more during peak hours (4–9 PM in most California and Texas utilities) — battery arbitrage can genuinely pencil out. In PG&E’s EV2-A rate structure, peak rates hit $0.55–$0.58/kWh in summer 2025. Storing cheap midday solar and discharging during peak hours can shave $80–$120/month off bills in high-consumption households.
However, if you’re on a flat-rate utility with 1:1 net metering still intact, the payback period for adding battery storage stretches to 12–15 years — which often exceeds the warranty period. In that scenario, the math doesn’t favor storage unless resilience and backup power are priorities for you personally.
Real-World Case Studies Worth Knowing
The NREL (National Renewable Energy Laboratory) publishes annual residential solar performance data, and their 2024 dataset (the most recent full-year figures available in 2025) shows median system performance ratios of 0.78–0.82 across US installations — meaning real-world output is typically 78–82% of nameplate capacity once you account for temperature derating, inverter losses, and soiling. If a salesperson quotes you output based on 100% nameplate capacity, that’s a red flag.
Germany’s Bundesnetzagentur tracks European residential solar performance, and their data consistently shows that systems installed with professional shading analysis tools (like Aurora Solar or PVsyst simulations) outperform self-reported estimates by 8–11% annually. In the US, platforms like Aurora Solar are now standard among quality installers — ask to see the simulation report before committing.
On the installer side, EnergySage’s 2025 Marketplace Report shows that homeowners who get 3+ competing quotes save an average of $3,600 compared to those who go with the first proposal. That single piece of advice is probably worth more than anything else in this article.
Realistic Payback Periods by Region (2025 Estimates)
- California (high electricity rates, good sun): 6–8 year payback, 25-year IRR of ~12–15%
- Texas (variable rates, moderate sun): 8–10 years, depending heavily on utility and TOU structure
- Northeast US (lower sun hours, high rates): 9–11 years for Massachusetts; SMART incentive program still active and improves ROI
- Southeast US (moderate rates, good sun): 10–13 years; net metering rollbacks in states like Georgia and Florida are compressing returns
- Pacific Northwest (low electricity rates, moderate sun): 14–18 years — solar is the hardest sell here purely on economics
Questions to Ask Any Installer Before Signing
- What is the DC-to-AC ratio of this proposed system, and have you accounted for clipping losses?
- Can I see the PVsyst or Aurora Solar simulation report with P50 and P90 yield estimates?
- What inverter brand and model are you proposing, and what’s the warranty structure?
- What is my utility’s current net metering policy, and has it changed in the last 12 months?
- Is your company NABCEP-certified, and who will physically be doing the installation?
- What does the monitoring system look like, and how will I know if a panel or inverter underperforms?
That last question matters more than most people realize. My neighbor had no monitoring visibility for the first six weeks — by the time he noticed the problem, he’d already missed the peak summer production window.
When Solar Might Not Be the Right Move Right Now
I want to be honest here, because the sales pitch often leaves this part out. If your roof is more than 15 years old and will need replacement in the next 5–7 years, installing solar now means paying to remove and reinstall the panels later — typically $2,500–$4,000 extra. Better to re-roof first. Similarly, if you’re planning to sell the home within 3 years, the evidence on solar adding to resale value is real (Zillow data suggests ~4% premium on average) but highly location-dependent — it’s less clear in markets where buyers aren’t yet solar-literate.
If your primary goal is reducing carbon footprint and the economics are marginal in your region, consider whether a cold-climate heat pump upgrade might deliver faster payback and equivalent emissions reduction — often with lower upfront cost.
From one homeowner to another: Solar in 2025 is genuinely compelling for a lot of people, but the difference between a great investment and a frustrating one almost always comes down to the details — orientation, inverter sizing, net metering terms, and installer quality. Get multiple quotes, ask for the simulation data, and don’t let anyone rush you. The panels will still be available next month, but a bad contract is hard to undo.
📚 관련된 다른 글도 읽어 보세요
- Why I Almost Gave Up on Hydroponic Lettuce — Real 2025 Beginner’s Guide That Actually Works
- 현직 엔지니어가 말하는 진짜 문제 — Claude API 한번에 성공하는 실제 세팅법 2026 기준
- 그냥 사면 후회해요 — 2026년 기준 전기차 보조금 싹 다 받는 실전 체크리스트
태그: []
Leave a Reply