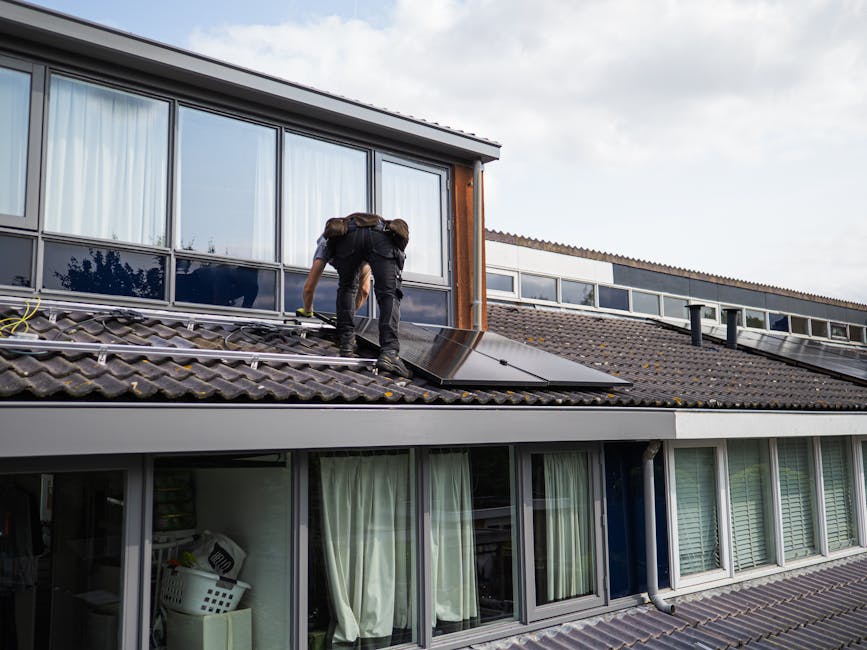
A friend of mine — let’s call him Dave — spent nearly $18,000 on a rooftop solar installation last spring. Three months in, his energy bill barely budged. His installer blamed “grid conditions,” his utility company blamed “system sizing,” and Dave was left holding the bag with a half-functioning setup and zero answers. That story stuck with me, because Dave isn’t unusual. The solar industry is booming, but so are the gaps between marketing promises and lived reality.
If you’re researching rooftop solar right now, you’re probably seeing headlines about record-low panel prices and 30% federal tax credits. Both are true. But there’s a layer underneath that most guides conveniently skip — and that’s exactly what we’re going to dig into together today.
The Numbers That Actually Matter in 2025
Let’s start with the honest financial picture. The average residential solar installation in the U.S. currently runs between $2.95 and $3.50 per watt before incentives, according to the Lawrence Berkeley National Laboratory’s Tracking the Sun dataset. For a typical 8 kW system, that’s roughly $23,600–$28,000 upfront.
Now apply the federal Investment Tax Credit (ITC), which sits at 30% through 2032 under the Inflation Reduction Act. That brings your out-of-pocket cost down to roughly $16,500–$19,600. Add state-level incentives (California’s SGIP, Massachusetts’ SMART program, New York’s NY-Sun initiative) and that number can drop further — sometimes by another $2,000–$5,000 depending on your location.
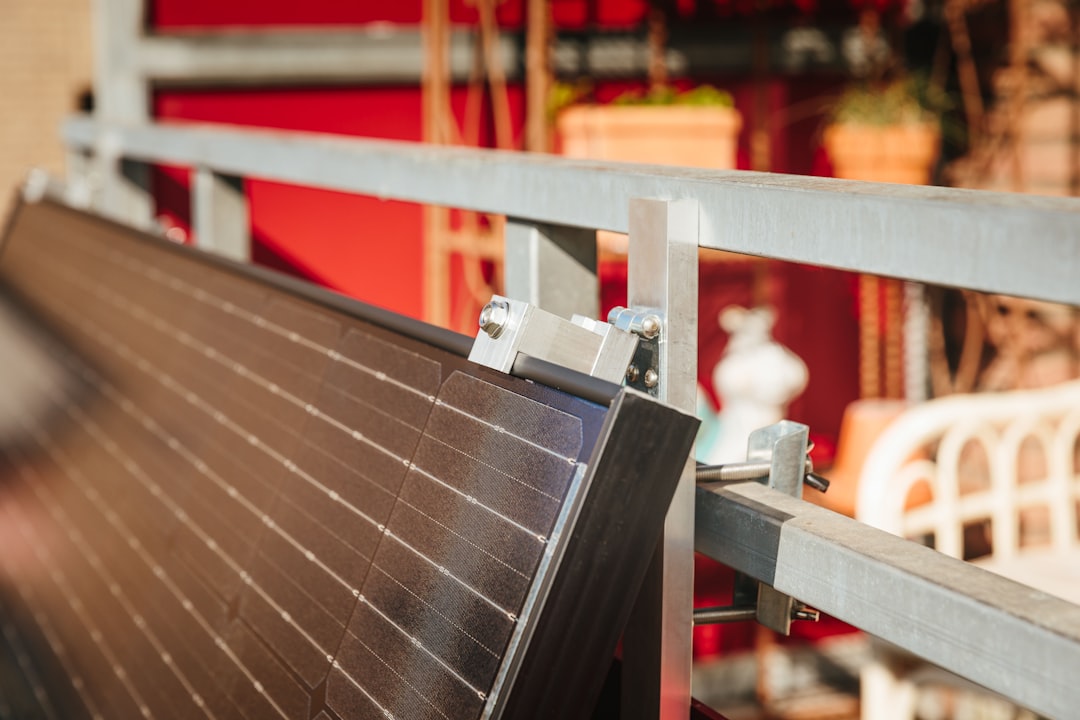
But here’s where Dave went wrong: he optimized for upfront cost instead of system performance ratio. A well-designed system should achieve a performance ratio of 0.75–0.82 (the ratio of actual output vs. theoretical maximum). Dave’s system was clocking around 0.61 — a red flag that points to shading issues, inverter mismatch, or suboptimal panel orientation that his installer never flagged.
Panel Technology: Not All Watts Are Equal
The market in 2025 has consolidated around a few clear tiers, and knowing the difference saves real money:
- Monocrystalline PERC panels (mainstream choice): Efficiency ranges 20–22%. Brands like Qcells Q.PEAK DUO and REC Alpha offer solid warranties (25 years product, 25 years performance) at around $0.70–$0.85/watt wholesale. Best for most residential installs.
- TOPCon panels (emerging standard): Efficiency 22–24%. Longi Hi-MO X6 and Jinko Tiger Neo are pushing this category hard. Better low-light performance — meaningful if you’re in the Pacific Northwest or New England. Price premium is ~10–15% over PERC, but the degradation rate is lower (typically 0.4%/year vs. 0.55%/year).
- Heterojunction (HJT) panels (premium tier): Efficiency 24–26%. Panasonic EverVolt HK Black and REC Alpha Pure are leaders here. Extremely low degradation (~0.25%/year), which matters over a 25-year horizon. Best ROI if your roof space is constrained.
- Bifacial panels: Capture reflected light from below. Only worth the premium if your roof has a light-colored surface or you’re doing ground-mount. On a dark asphalt shingle roof, the gain is negligible — often less than 3%.
Inverters: The Component Most People Ignore
Here’s a hard truth: the inverter is where most residential solar systems fail or underperform. Your panels might last 30 years. Your inverter? Plan for a replacement around year 10–15.
In 2025, the three main options are:
- String inverters (e.g., SMA Sunny Boy, Fronius Primo): Most cost-effective for unshaded roofs with simple layouts. A single shaded panel drags down the entire string — this is almost certainly what happened to Dave. Price range: $1,000–$2,500 for an 8 kW system.
- Microinverters (e.g., Enphase IQ8 series): Each panel operates independently. Shading one panel doesn’t affect the others. The IQ8 has a standout feature — it can form a “grid-agnostic” microgrid and provide backup power during outages even without a battery. Premium of roughly $1,500–$3,000 more than string for an equivalent system, but often worth it on complex rooflines.
- Power optimizers + string inverter (e.g., SolarEdge HD-Wave): A middle ground. Optimizers handle panel-level MPPT, the string inverter handles conversion. Good performance with moderate cost premium. The SolarEdge S440 optimizer paired with an HD-Wave inverter is a popular combo right now.
If your roof has even one persistent shading source — a chimney, a neighboring tree, a dormer — skip the pure string inverter. The performance loss compounds every single day for 25 years.
The Battery Question: When Does Storage Actually Pencil Out?
Battery storage is the most emotionally driven purchase in residential solar, and that emotion often overrides the math. Let’s be honest about when it makes financial sense:
It makes strong sense if: you’re in a state with Time-of-Use (TOU) rates (California PG&E, Arizona APS, Texas ERCOT market participants), where the spread between peak and off-peak rates exceeds $0.15/kWh. Or if you’re in a high-outage-risk area and the peace of mind has real dollar value to you. The Tesla Powerwall 3 (13.5 kWh, ~$11,500 installed) and the Enphase IQ Battery 5P (~$8,000–$10,000 installed for 5 kWh) are the current market leaders.
It often doesn’t pencil out if: your utility offers full retail net metering (NEM 2.0 or equivalent). In that case, the grid is essentially your free battery — you export excess during the day and draw it back at night at 1:1 value. California’s NEM 3.0 shift in 2023 changed this calculus significantly, which is exactly why battery attachment rates in CA jumped from 18% to over 45% of new installs since then.
Real-World Case Studies Worth Knowing
A 2024 analysis by EnergySage (one of the largest U.S. solar marketplace platforms, with data from over 30,000 quotes) found that the median payback period for residential solar was 7.5 years — but ranged from as low as 4.5 years (Massachusetts, with strong state incentives + high electricity rates) to as long as 12 years (states with low utility rates like Louisiana or Idaho). Location isn’t just about sunshine hours; it’s fundamentally about electricity rate arbitrage.
Internationally, Australia remains a fascinating benchmark — it has the highest residential solar penetration in the world (~35% of detached homes), driven by aggressive feed-in tariff programs and electricity prices averaging AUD $0.28–$0.35/kWh. Their experience consistently shows that installer quality is the single largest variable in system performance, outweighing panel brand choice in long-term outcome studies.
What to Actually Do Before Signing Anything
- Pull your 12-month utility bills first. Calculate your annual kWh consumption. A reputable installer sizes your system to offset 90–100% of this, not to sell you the largest possible system.
- Get at least 3 quotes through a platform like EnergySage or SolarReviews. The price variance between installers for identical equipment is often 20–30%. That’s thousands of dollars.
- Ask specifically about your Performance Ratio estimate. Any installer who can’t explain this metric or won’t provide a projected PR is a yellow flag.
- Check NABCEP certification. The North American Board of Certified Energy Practitioners certification is the industry’s gold standard for installers. It’s not mandatory, but its absence on a large install should prompt questions.
- Understand your interconnection timeline. In many markets, utility approval to go live (Permission to Operate, or PTO) takes 4–12 weeks after physical installation. Your system sits idle during this window — plan accordingly.
- Read the production guarantee. This is different from the equipment warranty. Some installers offer a production guarantee (they’ll pay you if the system underproduces). This is a meaningful differentiator.
The Honest Bottom Line
Rooftop solar in 2025 is genuinely one of the stronger long-term financial decisions available to homeowners — if you approach it like an engineer rather than a consumer. The technology is mature, the incentives are real, and the payback math works in most U.S. markets with electricity rates above $0.12/kWh (which covers the majority of the country).
But the difference between Dave’s disappointing experience and a system that cuts your bill by 80% comes down almost entirely to design quality and installer diligence — not panel brand, not financing offer, not the salesperson’s enthusiasm.
If you’re not ready to install yet, consider at minimum getting two or three quotes now to understand your local market pricing. EnergySage quotes are free and give you a real baseline. You can always wait — panel prices are unlikely to spike dramatically — but the 30% ITC is time-limited, and your cumulative electricity payments while you wait are a very real cost.
One thing I’d genuinely encourage: Before any sales conversation, spend 20 minutes on PVWatts (the NREL free calculator at pvwatts.nrel.gov) and run your own rough production estimate. When an installer’s proposal matches your independent estimate within 10–15%, that’s a green flag that they’re being straight with you. When it’s dramatically higher, now you know to ask why.
📚 관련된 다른 글도 읽어 보세요
- Why I Stopped Trusting ‘Set It and Forget It’ — Real 2025 Guide to {keyword}
- 믿었다가 뒤통수 맞는 수동변속기 — 2026년 기준 MT 차량 실사용 전 반드시 알아야 할 것들
- 2026년 가성비 쩌는 싱글몰트 위스키 Top3 — 이거 모르면 돈 낭비입니다
태그: rooftop solar, solar panel installation, residential solar 2025, solar inverter, battery storage, solar ROI, home energy
Leave a Reply